The National Oceanic Atmospheric Administration (NOAA) provides historical weather data from buoys throughout the world. Upon seeing a plot of continuous wind data, I recognized the similarity of this graph to a waveform display in a sound editor. I knew that this sound file would not be particularly interesting of it own accord, so I determined to use other available data to granulate the file, projecting that a slow traversal of the sound file with data synchronously related could create interesting sonic results.
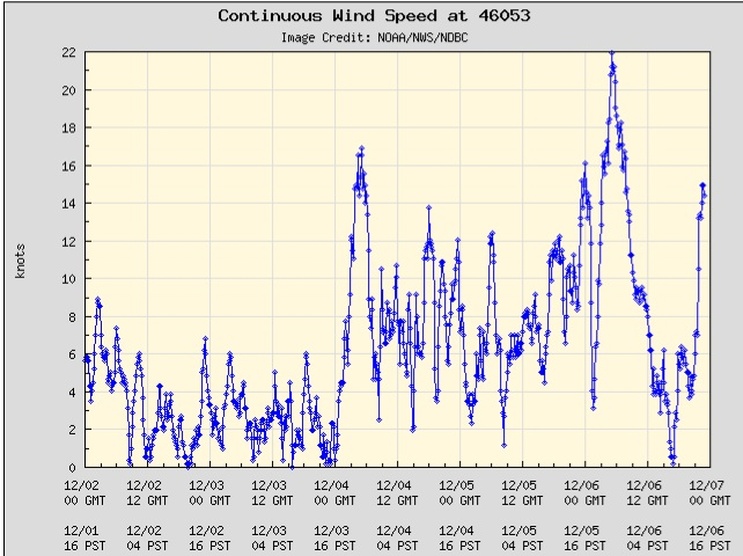
A Plot of the Continuous WindSpeed
from http://www.ndbc.noaa.gov/show_plot.php?station=46053&meas=spd&uom=E&time_diff=-8&time_label=PST
from http://www.ndbc.noaa.gov/show_plot.php?station=46053&meas=spd&uom=E&time_diff=-8&time_label=PST
The ability of old mariners to condense narratives of sailing voyages into relatively short stories told over several cocktails forced me to reflect on the compression of data. A sailboat is subject to continuous forces from wind and waves, mapping these datas to both sound and control parameters suggested an approach. My goal in this project was to find a way to present the continuous datain the hope that the salient/exciting moments would leap out of the texture.
A secondary goal of this project is the cultivation of MATLAB and SuperCollider skills in order to implement sonification with large datasets.
